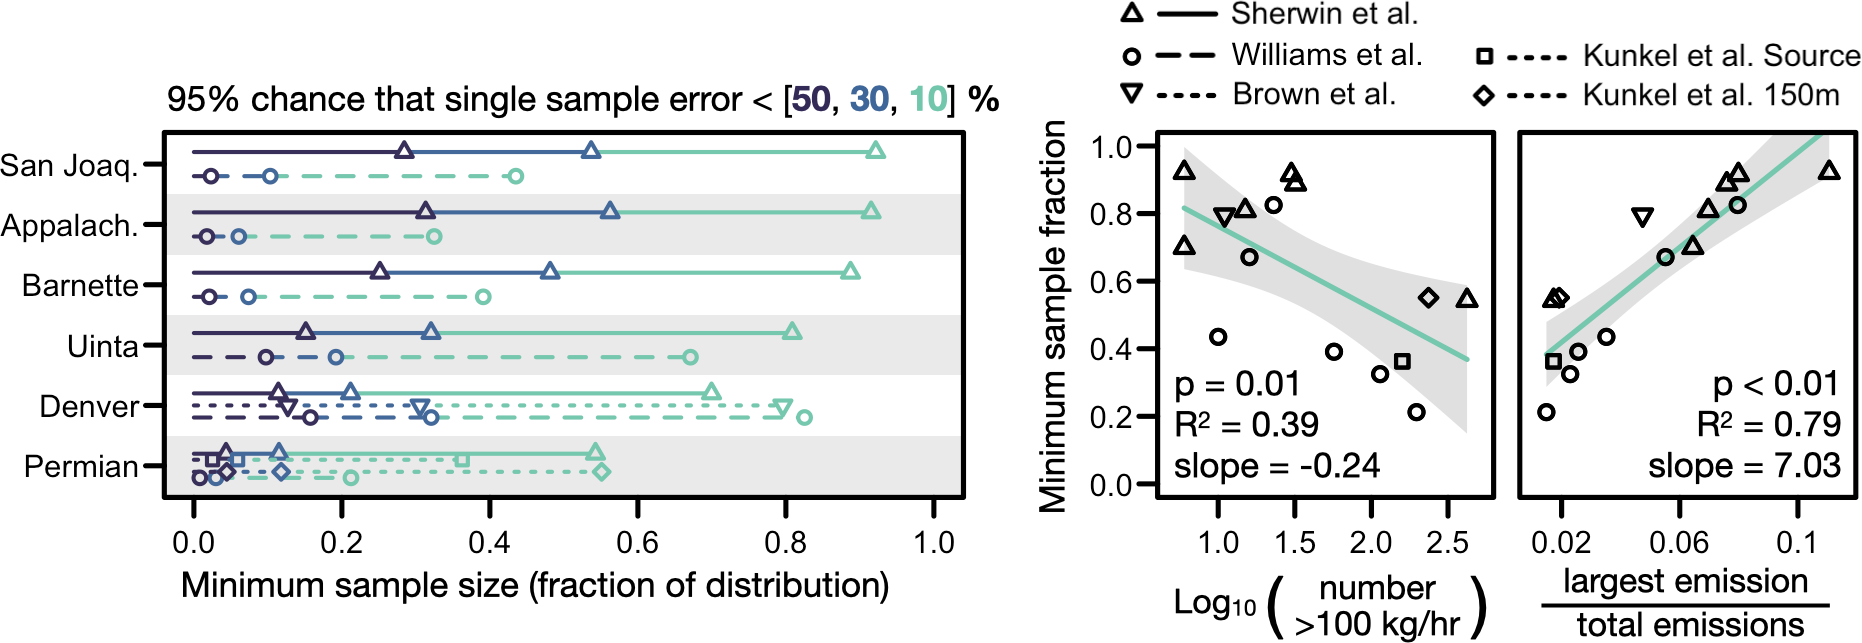
Sample size guidance for methane measurement campaigns
How many oil and gas sites do you need to measure to obtain an accurate estimate of average emissions across a broader population of sites? This question has important implications for creating measurement-informed emissions inventories, but it is complicated by the fact that oil and gas methane emissions follow highly right-skewed distributions, where a small number of “super-emitters” heavily influence total emissions. We quantify some of the statistical implications of sampling from these distributions using six US oil and gas basins as an example and provide sample size guidance to bound errors introduced by sampling variability. We find that characteristics of the largest emissions drive sample size requirements and that differences between basins necessitate basin-specific sampling strategies.
We created an interactive web tool to reproduce the analysis in the paper. If you already have some emissions information for a more specific study domain (e.g., data from a previous measurement campaign), then you can upload that distribution of emission rates to the web tool for even more targeted sample size guidance. Credit to Michael Basanese at the Colorado School of Mines for developing the web tool!
Sampling paper: Daniels et al., 2026
Web tool: Sampling variability app
Inverse methods for point sensor networks
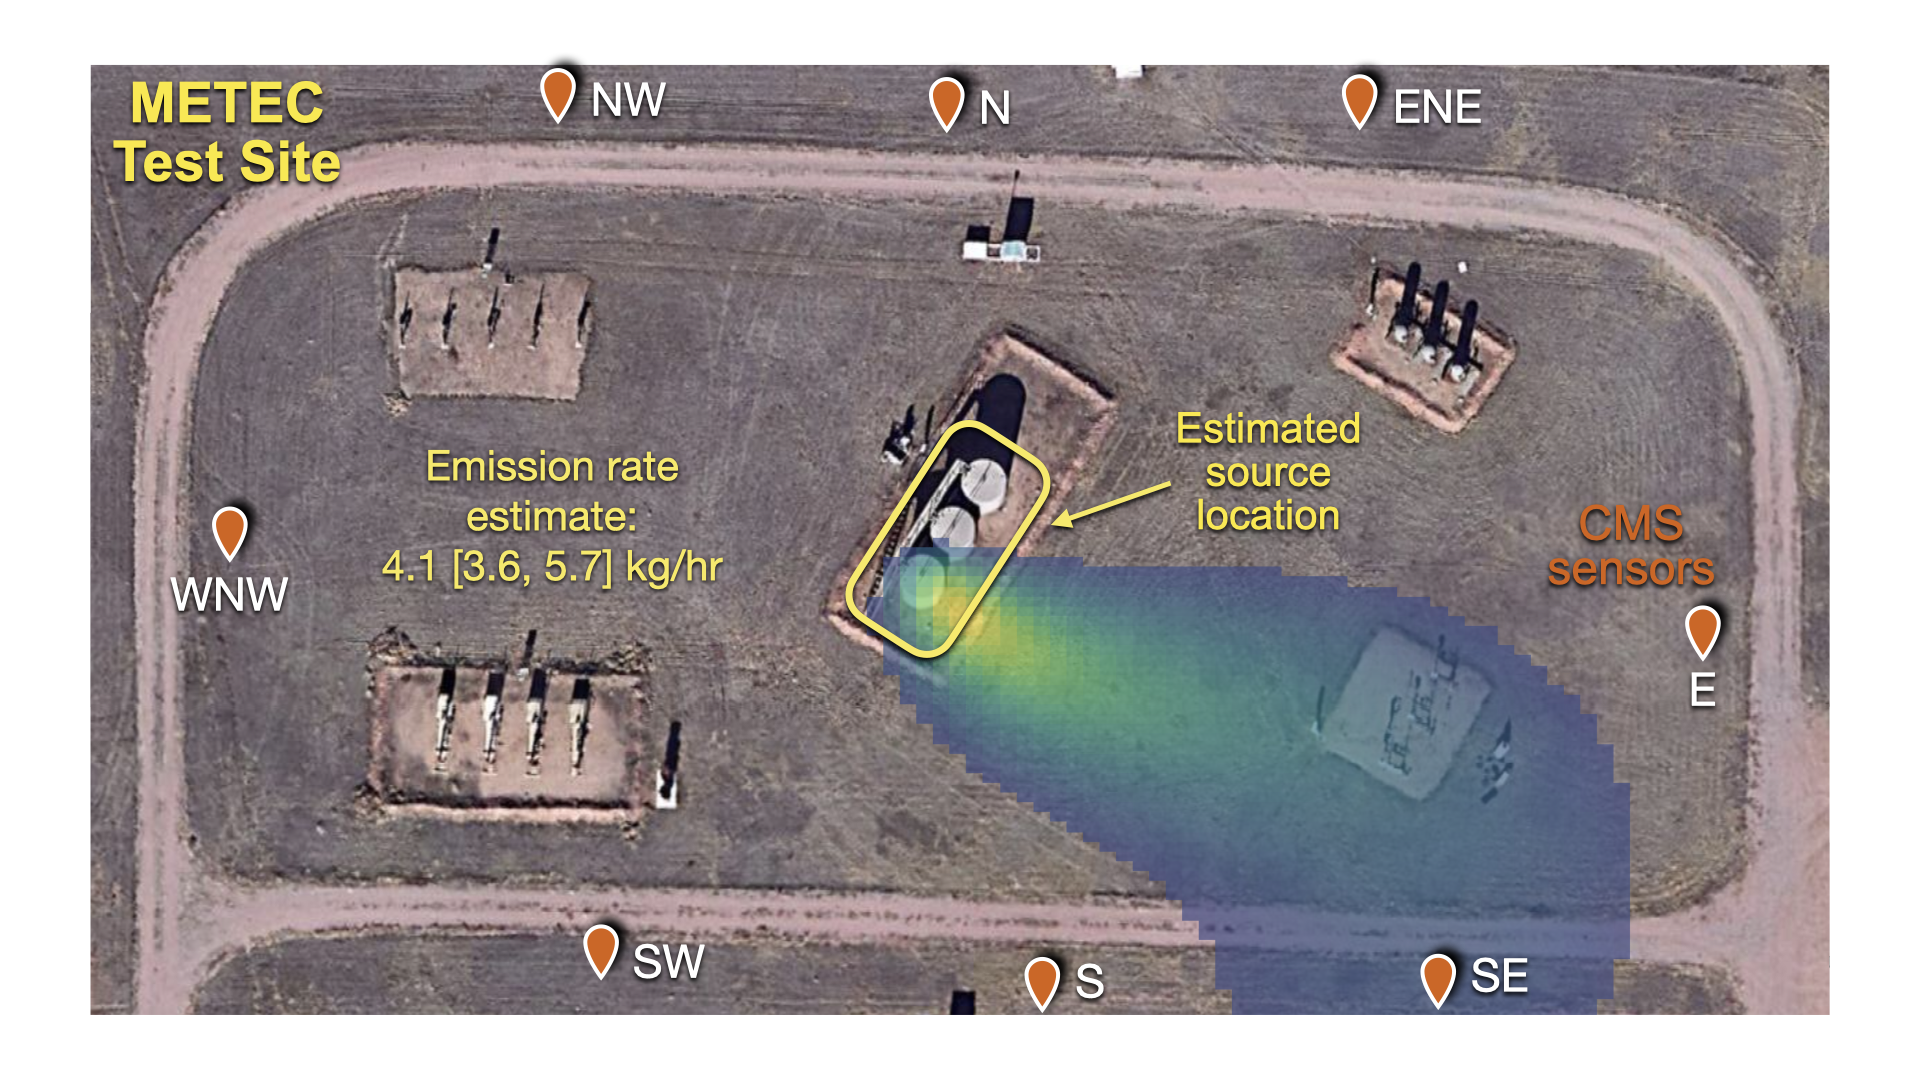
We developed two inverse methods for estimating methane emission source and rate on oil and gas facilities using concentration and wind data from point sensor networks. Both models use an atmospheric transport model to forward simulate the movement of methane from source to sensor. The first model is theoretically and computationally simpler, but relies on the assumption that only one source is emitting at a time. We call this model the detection, localization, and quantification (DLQ) model. The paper on the DLQ model also introduces an algorithm for identifying rapid enhancements (“spikes”) in a concentration time series, which has a wide variety of applications. The second model uses a hierarchical Bayesian framework to estimate emission rates and relaxes the single source assumption. We call this model the multisource detection, localization, and quantification (MDLQ) model. The MDLQ model accounts for autocorrelation in the sensor data and uses a sparsity-inducing prior to reflect the intermittent nature of methane emissions on oil and gas sites.
Both models have been evaluated on controlled releases at the Methane Emissions Technology Evaluation Center (METEC). The code behind these models is completely open-source, providing a baseline level of performance for private sensor solutions operating in this space.
DLQ model (single source) paper: Daniels et al., 2024
DLQ model (single source) code: GitHub
MDLQ model (multisource) paper: Daniels et al., 2026
MDLQ model (multisource) code: coming soon!
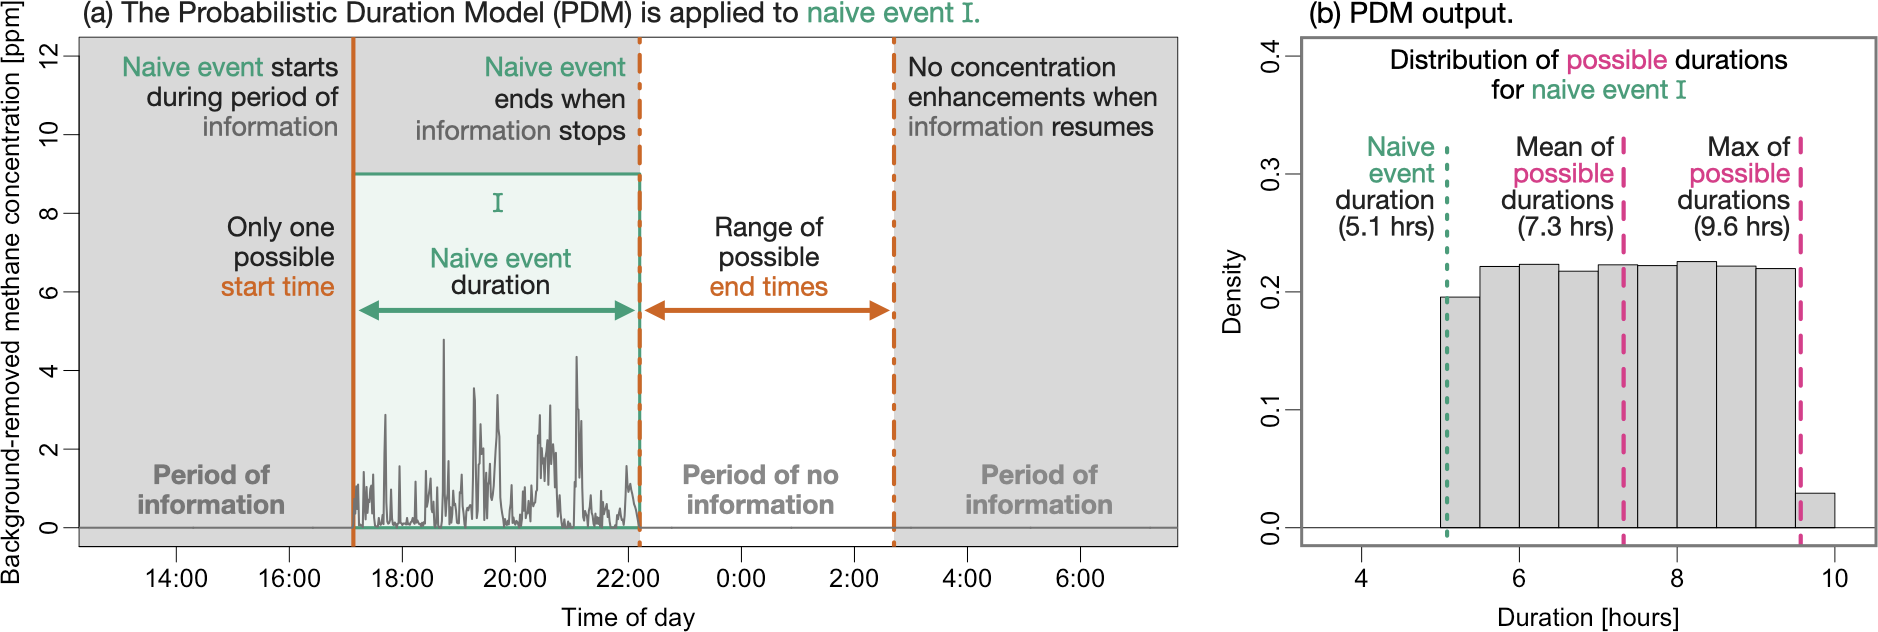
Estimating methane emission durations using point sensor networks
We created a probabilistic model to estimate methane emission durations using concentration data from continuous monitoring systems (CMS) on oil and gas sites. We refer to this model as the Probabilistic Duration Model (PDM). The PDM accounts for a key feature of CMS data: non-detect times, or the times when wind blows emitted methane between CMS sensors. Non-detect times can be incorrectly interpreted as periods of no emissions and therefore must be addressed when performing any inversion with CMS data. The PDM identifies non-detect times using an atmospheric transport model and probabilistically accounts for the fact that emissions can persist into or through these non-detect times. We show that CMS can be used to bound the duration of snapshot methane measurements, but the PDM (or a comparable method) must be used to account for non-detect times. All of the PDM code is open-source.
PDM paper: Daniels et al., 2024
PDM code: GitHub
Fast implementation of the Gaussian puff dispersion model
We created a computationally efficient implementation of the Gaussian puff model for the atmospheric transport of methane (or other trace gasses) in near-field environments. The implementation reduces unnecessary calculations by limiting the number of active puffs in the simulation via an adaptive spatiotemporal threshold, achieving over a 100x speedup compared to a naive implementation. Using controlled release data from the Methane Emissions Technology Evaluation Center (METEC), we show that the Gaussian puff model outperforms the more commonly used Gaussian plume model for near-field transport. This fast, lightweight model supports real-time emission inference from continuous monitoring systems and is suitable for large-scale deployment. Plus, all of the code is open-source!
Fast Gaussian puff paper: Jia et al., 2025
Fast Gaussian puff code: GitHub
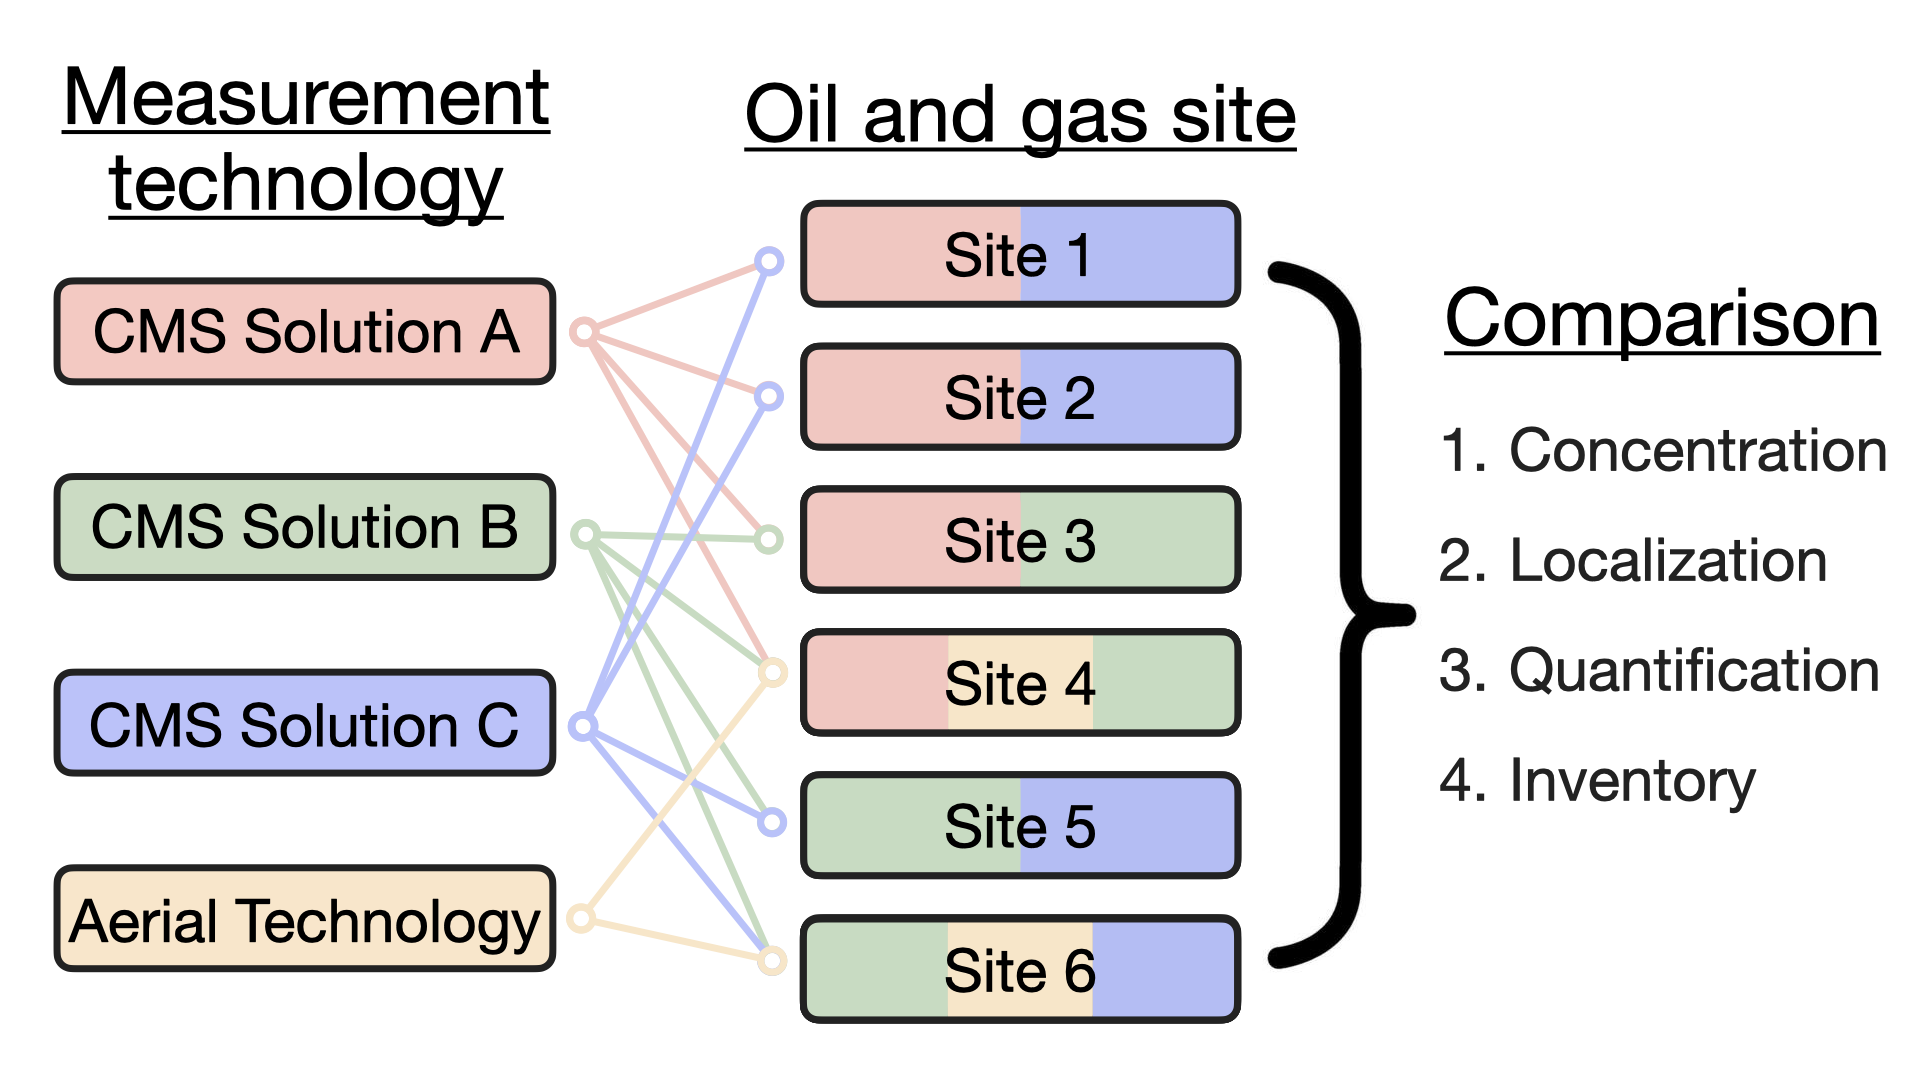
Evaluation of continuous monitoring systems on operating sites
We compared continuous monitoring systems (CMS) from three different vendors on six operating oil and gas sites. We highlight similarities and differences between the three CMS solutions when deployed in the field and compare their output to concurrent top-down aerial measurements and to site-level bottom-up inventories. Furthermore, we compare vendor-provided emission rate estimates to estimates from an open-source quantification algorithm applied to the raw CMS concentration data. This experimental setup allows us to separate the effect of the sensor platform (i.e., sensor type and arrangement) from the quantification algorithm. Results from this study have important implications for developing measurement-informed inventories and for incorporating CMS-inferred emission characteristics into emission mitigation efforts.
Intercomparison paper: Daniels et al., 2025
Tracking supply chain-specific methane emissions
We conducted a large-scale methane measurement campaign across the production, midstream, and liquefaction segments of the oil and gas supply chain to estimate supply chain-specific intensities. We showed that emissions can fluctuate dramatically on short time scales and that high frequency measurements from continuous monitoring systems can help interpret individual snapshot measurements from aerial or satellite platforms. We wrote two papers for each segment of the supply chain and one synthesis paper. Papers that I was involved in are bolded below.
Production Paper #1: Wang et al., 2022
Production Paper #2: Daniels et al., 2023
Midstream Paper #1: Brown et al., 2023
Midstream Paper #2: Brown et al., 2024
Liquefaction Paper #1: Zhu et al., 2024
Liquefaction Paper #2: Khaliukova et al., 2025
Synthesis Paper: Zhu et al., 2026
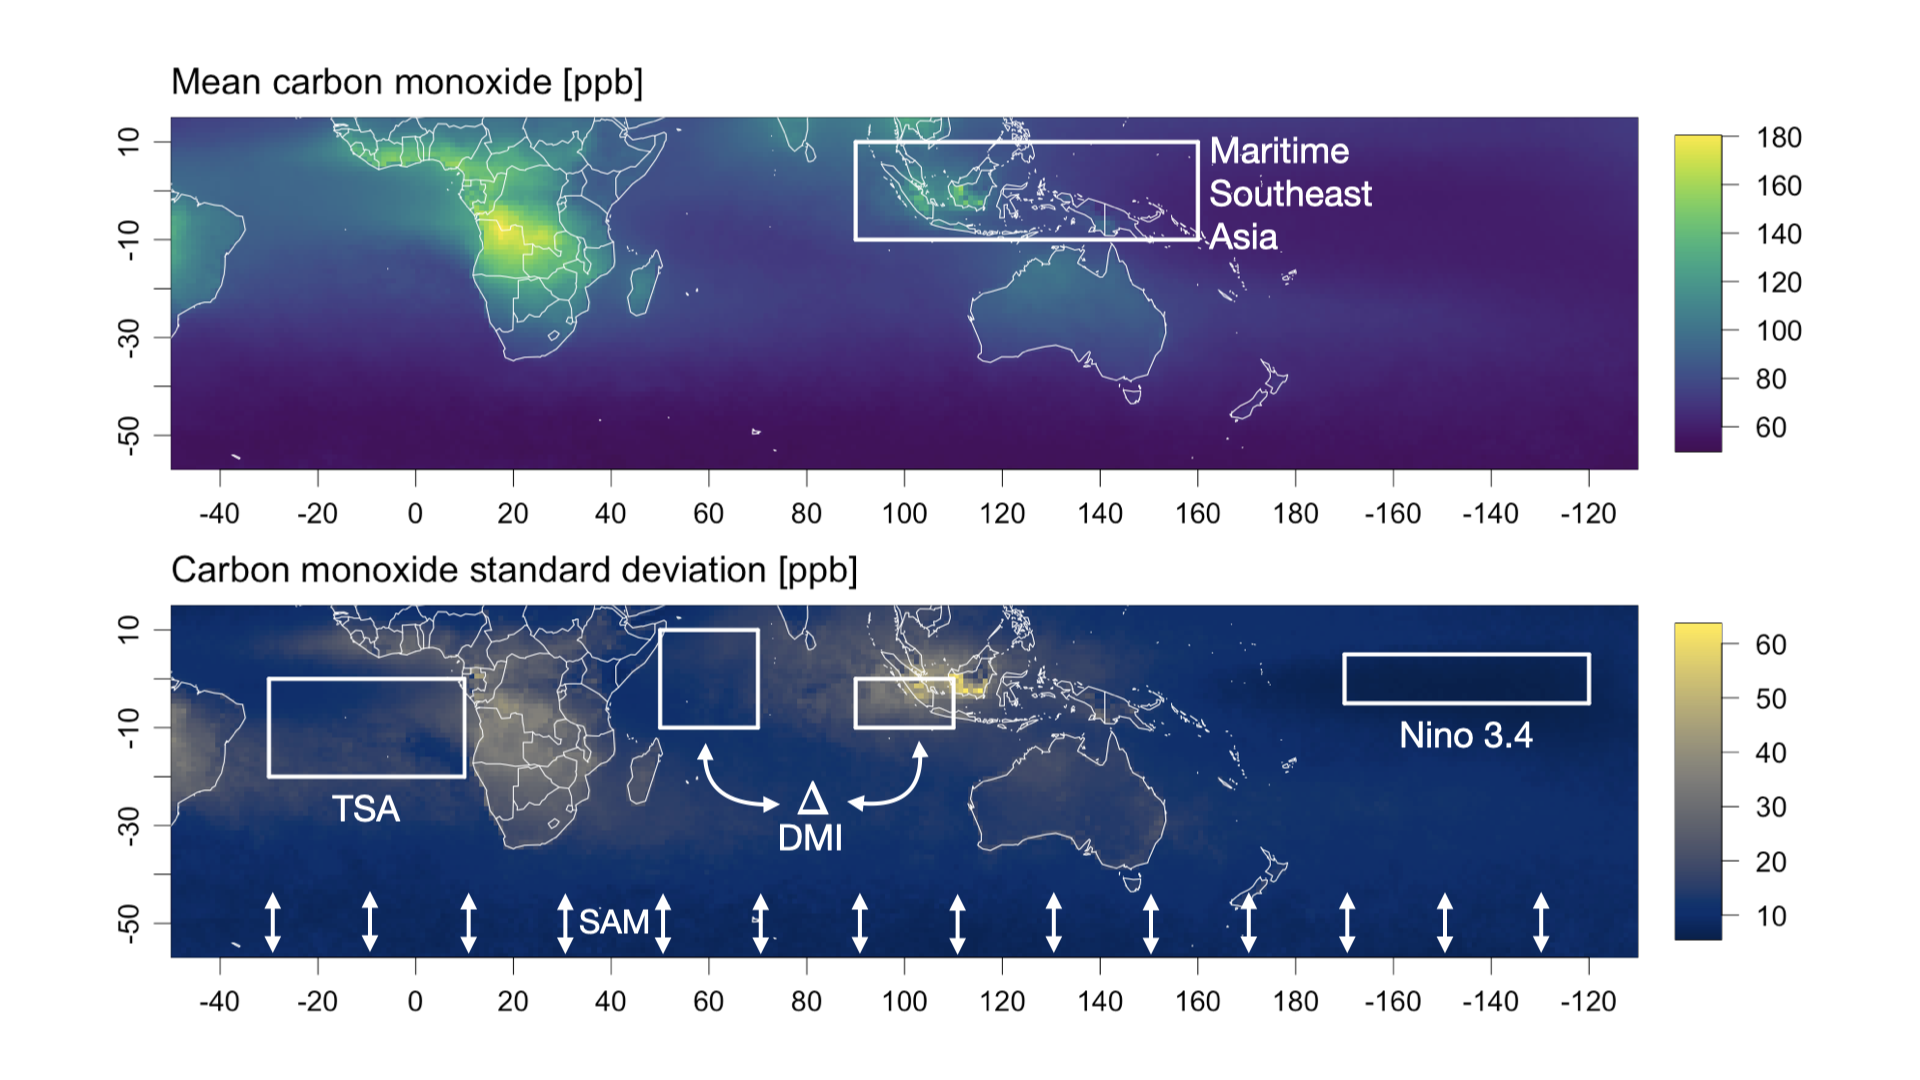
Interpretable models for fire season intensity
We investigated the relationship between climate variability and fire-season carbon monoxide (CO) enhancements in Maritime Southeast Asia (MSEA). Using satellite observations from 2001 to 2019, we built interpretable statistical models that relate weekly CO anomalies to major climate modes, including ENSO, the Indian Ocean Dipole, and the Madden–Julian Oscillation. ENSO explained the most variability in atmospheric CO, but we found that including nonlinear effects and interactions among climate indices significantly improved the models. Our results show that interpretable models can robustly quantify the impact of large-scale climate patterns on seasonal fire intensity and CO emissions in MSEA. Our approach provides a framework for projecting how climate variability may influence future biomass burning and atmospheric pollution under climate change. There have been two papers from this project. Papers that I was involved in are bolded below.
Models for all Southern Hemisphere fire regions: Buchholz et al., 2018
Updated model for Maritime Southeast Asia: Daniels et al., 2022